Welcome to The GeoWire , your Source for a Peek into GeoInvesting’s Research Coverage, Microcap Stock Education, Case Studies, Recommended Reading From Around the Web, Important Tweets of the Week, Premium Weekly Wrap Ups, Featured Videos, and More. Please hit the heart button if you like today’s newsletter and reply with any feedback.
If you are new or this was shared with you, you can join our email list here. Or you can click here to get all of our premium content.
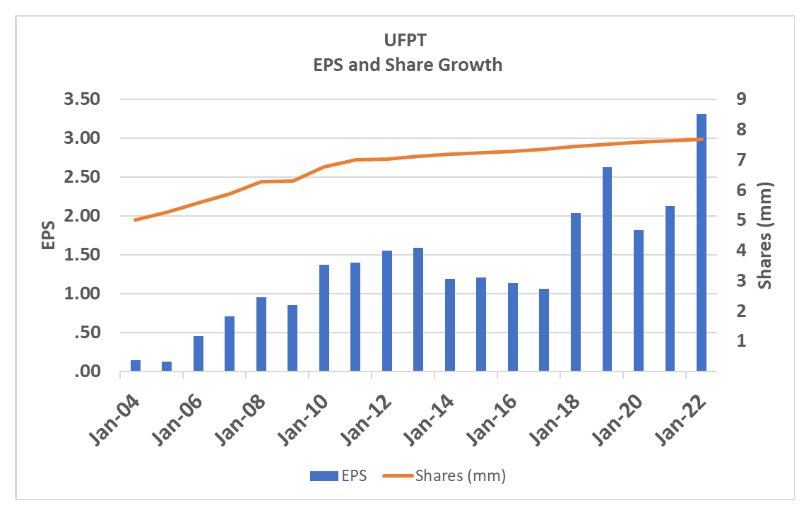
I was reflecting on a past GeoWire Weekly post from November 2022 where I addressed some factors that made Ufp Technologies, Inc. (NASDAQ:UFPT) a standout case study in what can happen when company management values maintaining the integrity of capital structure while growing revenue and EPS organically and through acquisitions – UFPT, a designer and custom manufacturer of components, subassemblies, products and packaging utilizing highly specialized foams, films, and plastics primarily for the medical market, made eight acquisitions since 1993.
The company relied on its strong balance sheet to minimally increase its share count as EPS trended higher from 2004, when its bottom line went positive, to 2022, the first time its adjusted EPS broke $3 per share.
It got me thinking some more about companies that had tremendous multibagger moves over the years while largely maintaining their share counts, and sometimes even decreasing them.
Of course, there are definitely multiple studies that can be done on stocks whose prices increase by many multiples – for example, you can analyze the volatility of multibaggers before or after the meat of their growth cycles. Or just volatility in general.
As you can see above, you would have had to be patient from 2014 to 2018, as EPS growth took a break. Having said that, the stock did manage to increase about 13.5% in price from the mid $25s to about $29 per share. Psychologically, if you were someone that was looking for a bit more than an annualized return of about 3.5% per year in that time frame, you most likely would have bolted, but eventually regretted it after the stock eventually went on to hit $120.
And what about drawdowns? Are you able to navigate them and have faith in an eventual multibagger move somewhere down the line?
That parlays perfectly into the dissection of trading disciples and the rewards they could have reaped (or not). The rewards part can be tricky. I held Monster Beverage Corporation (NASDAQ:MNST) back in the day…for a double. That is not a very warm and fuzzy feeling knowing that even a small portion left to set and forget would have made me a very happy man.
My 14-year holding of Koru Medical Systems, Inc. (NASDAQ:KRMD) was the antithesis of my stint with MNST. My current gain in that stock is 1475%, having ridden it from $0.24 to today’s price of $3.78. But it’s important to note that during this period, the stock did attain a peak of $12.70, a 5292% rise.
We believe KRMD’s performance took a pause during a slight restructuring of its business plan under the new CEO, Linda Tharby, with whom we will be trying to get another update with her through a Fireside Chat or Management Morning Briefing soon.
What about the multi-busts? There’s an interesting idea we’ll probably dig into a little later – those top performers that fell apart after a stellar run.
For today, I’m going to stick with the simple task of looking at some GeoInvesting-covered stocks that fit in the frame of share consistency complimented by healthy growth on the bottom line while in their accelerated growth phases..
On that note, of particular import is my continual emphasis of points from our Tier 1 Quality Microcap Checklist that are commonly shared by historically overachieving stocks.
First I look for stocks with low share counts of under 50 million. And to be quite honest, we’re usually buying stocks that sport under 20 million shares outstanding. And early in my career, my screens would actually only look for stocks with under 10 million. Now, the examples I show below don’t necessarily fit this mold, but they more than made up for it in their EPS growth.
Second, how has management treated their companies’ share structures over time? Was there dilution, and if there was, did the growth of the company mitigate this? I’ve always contended that the historical shares outstanding of a company represent the soul of the management team. It’s either pure of heart, or complicit in destroying shareholder value.
Third, how serious are insiders about owning stock in their own companies? They’re obviously going to treat their ownership interest with more earnestness and think twice about diluting their interest by issuing shares. A lack of insider ownership is one of the issues we had with our coverage of Spar Group, Inc. (NASDAQ:SGRP). It’s a caveat that’s not always a red flag, especially if we see other major things we like, as is the case with that company. It’s just something to be aware of.
So, let’s take a look at a few GeoInvesting covered multibaggers whose EPS increased healthily through 2021 (before the market started to slump) while the growth rate of their share counts remained tame, ultimately setting the stage for great returns.
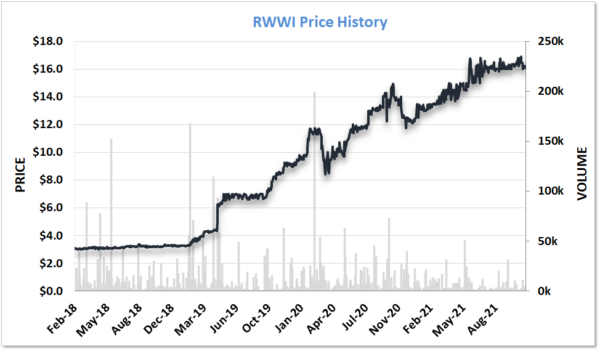
Rand Worldwide Inc (OOTC:RWWI) (Data management solutions)
| Fiscal Yr. EPS | Shares, end of Fiscal Yr. | Price | ||||
| Coverage Began | 2018 | 2021 | 2018 | 2021 | 2018 | 2021 |
| 2018 | 0.03 | 0.62 | 33.03 | 33.47 | 3.7 | 16.6 |
| Growth >> | 1,966.67% | 1.33% | 348.65% | |||
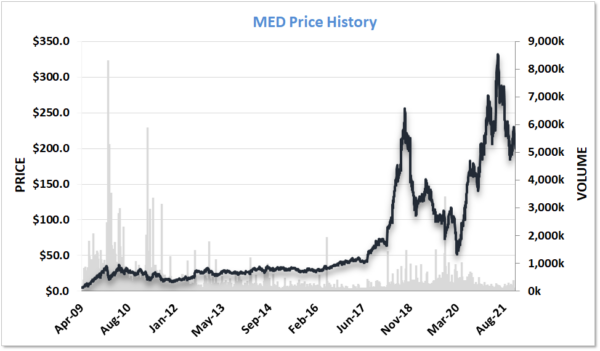
Medifast Inc (NYSE:MED) (Healthy living products)
| Fiscal Yr. EPS | Shares, end of Fiscal Yr. | Price | ||||
| Coverage Began | 2009 | 2021 | 2009 | 2021 | 2009 | 2021 |
| 2009 | 0.77 | 13.89 | 14.74 | 11.81 | 5.00 | 198.71 |
| Growth >> | 1,703.90% | -19.88% | 3,874.20% | |||
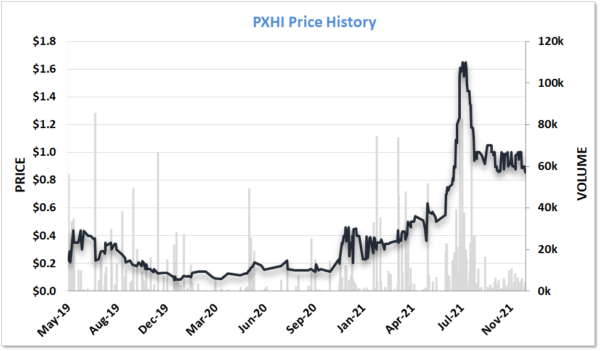
Phonex Holdings Inc (OOTC:PXHI) (Wholesale exchange of used smartphones)
| Fiscal Yr. EPS | Shares, end of Fiscal Yr. | Price | ||||
| Coverage Began | 2019 | 2021 | 2019 | 2021 | 2019 | 2021 |
| -0.158 | 0.14 | 29.7 | 43.13 | 0.13 | 0.98 | |
| Growth >> | 188.61% | 45.22% | 653.85% | |||
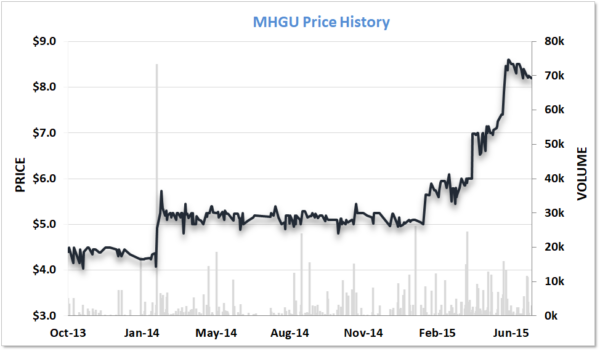
Meritage Hospitality Group Inc (OOTC:MHGU) (Quick-service and casual dining restaurants)
| Fiscal Yr. EPS | Shares, end of Fiscal Yr. | Price | ||||
| Coverage Began | 2013 | 2021 | 2013 | 2021 | 2013 | 2021 |
| 2013 | 0.001 | 1.81 | 5.55 | 9.6 | 4.4 | 20.95 |
| Growth >> | 180,900% | 72.97% | 376.14% | |||
Paysign, Inc. (NASDAQ:PAYS) (Prepaid card products and processing services)
| Fiscal Yr. EPS | Shares, end of Fiscal Yr. | Price | ||||
| Coverage Began | 2014 | 2019* | 2014 | 2019 | 2014 | 2019 |
| 2015 | 0.002 | 0.137 | 39.64 | 54.55 | 0.25 | 2.22 |
| Growth >> | 6750.00% | 37.61% | 788.00% | |||
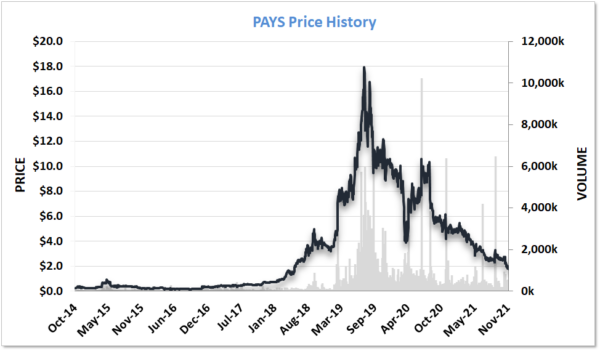
Note: 2019 was PAYS’ last profitable year before Covid-19
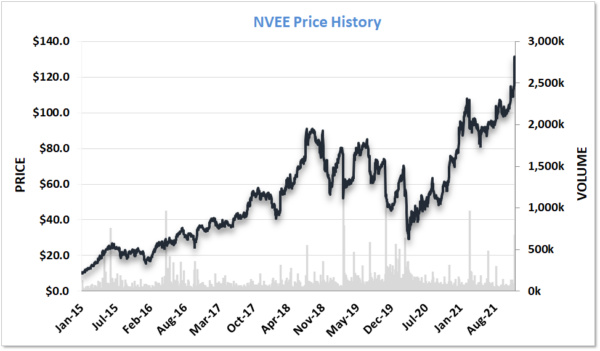
Nv5 Global, Inc. (NASDAQ:NVEE) (Technical and professional engineering services)
| Fiscal Yr. EPS | Shares, end of Fiscal Yr. | Price | ||||
| Coverage Began | 2014 | 2021 | 2014 | 2021 | 2014 | 2021 |
| 2014 | 0.87 | 3.22 | 7.22 | 14.66 | 11.75 | 136.62 |
| Growth >> | 270.11% | 103.05% | 1,062.72% | |||
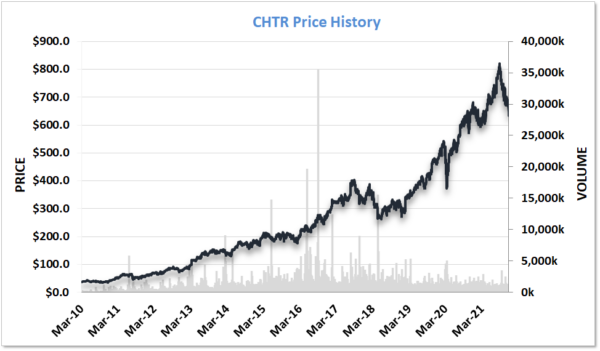
Charter Communications, Inc. (NASDAQ:CHTR) (Broadband connectivity and cable operator)
| Fiscal Yr. EPS | Shares, end of Fiscal Yr. | Price | ||||
| Coverage Began | 2010 | 2021 | 2010 | 2021 | 2010 | 2021 |
| 2010 | -1.62 | 26.51 | 102.3 | 193.04 | 36.49 | 593.34 |
| Growth >> | 1,736.42% | 88.70% | 1,526.03% | |||
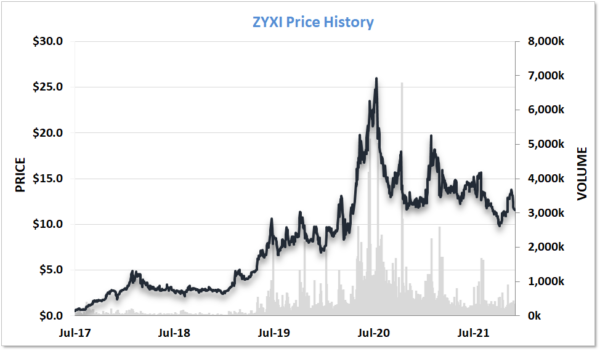
Zynex, Inc. (NASDAQ:ZYXI) (Medical Devices)
| Fiscal Yr. EPS | Shares, end of Fiscal Yr. | Price | ||||
| Coverage Began | 2017 | 2021 | 2017 | 2021 | 2017 | 2021 |
| 2017 | 0.2 | 0.44 | 36.52 | 39.2 | 0.36 | 9.06 |
| Growth >> | 120.00% | 7.34% | 2,416.67% | |||
Hi, part of this post is for paying subscribers
SUBSCRIBE
Already a paying member? Log in and come back to this page.
Our premium members also…
Get Access all Model Portfolios
Receive GeoInvesting Premium Alerts
Access to all stock pitches and Research Reports
Attend live interviews and fireside chats
Interact with the GeoTeam in Monthly Forums
Get in-depth stock research on 1000’s of microcap stocks
Thanks for joining thousands of other investors who follow GeoInvesting
Your free subscription includes first access to:
- Monthly publication of “The GeoWire” Newsletter sent to you the first Tuesday of every month, covering case studies, stats and fireside chats.
- Weekly emails highlighting the past week’s coverage at GeoInvesting sent 3x a month.
Get more out of GeoInvesting by trying us our premium package for free.
Step 1 – Receive quality research investment Ideas, model portfolios and education
Step 2 – Interact with us about our favorite ideas and the research that supports it; gain insight through all tools geo offers
Step 3 – Decide to build portfolios based on our research and Model Portfolios and updates including convictions, additions and removals of holdings.