We believe an information arbitrage opportunity exists with Gain Capital Holdings (NYSE:GCAP) and that GCAP’s stock price could soon more than double from its current price of around $5.50. Attentive investors have an opportunity to buy shares on the cheap, as more conservative investors wait for the official closing of an acquisition that will more than double the size of the company. Downside risk seems limited because of the fact that a competitor offered to buy the company for around $5.35 before GCAP announced that it had entered into an agreement to consummate a transformative acquisition. The board promptly rejected this offer. We have coded GCAP as our next GeoBargain.
GeoInvesting does not normally buy stock in companies that conduct business in the financial industry. However, we will make an exception when we come across a compelling investment idea:
- On July 12, 2011 we coded Advance America (NYSE:AEA) as a GeoSpecial at $8.45. AEA is a provider of non-bank cash advance services. On February 15, 2012 AEA agreed to be acquired for $10.50 per share.
- On August 17, 2012 we alerted our premium members that we were going long Consumer Portfolio (NASDAQ:CPSS), a company that operates as an automobile finance lending business catering to sub-prime borrowers. On November 8, 2012 we coded the stock as a GeoBargain at $3.68, telling our premium members that a recent drop in its share price was an early Christmas present. We eventually removed CPSS from our GeoBargain list on January 9, 2013 at $6.67 for a handsome return of 81%. The stock went on to eventually hit $12.79 before retracing to its current levels of around $8.00 per share.
- On August 30, 2012 we added Security National Financial (NASDAQ:SNFCA), a stock that operates in three sectors consisting of life insurance, cemetery and mortuary services, and mortgage loans, to our 52 week high screen at the price of $4.48. On November 23, 2012 we informed our premium members that we were adding to our position at $5.95 following the release of bullish financial results disclosed in its third quarter 10Q and prior to the issuance of an earnings press release. We eventually let our members know that we unwound our position on January 18, 2013 at $10.90. This information arbitrage opportunity earned us a return of roughly 140%. The stock went on to eventually hit $15.39 before retracing to its current levels of around $7.15 per share.
- Finally, on November 1, 2012 we sent our bullish thesis “information arbitrage” on Hilltop Holdings (NYSE:HTH), a banking institution, to investors. We pointed that the market was not appropriately valuing HTH shares to account for the closing of a pending accretive acquisition that we predicted would occur. The acquisition was consummated and HTH ultimately reached our price target, equating to a 25% return.
Introducing Gain Capital Holdings
GCAP mainly generates revenue from two sources.
Trading Revenue
In 2012, 84% of revenues were derived from its market-making business that executes transactions for GCAP’s retail customers (individual investors) trading forex products and precious metals via the website Forex.com, owned by GCAP. The majority of revenue from market-making activities is derived from the difference between the bid/ask spread during the execution of a trade. In these cases the company’s risk exposure is limited since the company offsets each side of the trade from its retail client asset base or with wholesale fx brokers (both referred to as a “hedged position). In some instances, GCAP does not execute both sides of a trade so that revenues are impacted by gains and losses generated through changes in the market value of “un-hedged” positions (2% of average daily retail trading volume in 1Q13).
Commission Revenue
The company’s other main source of revenue is derived from charging a commission for facilitating trades for its institutional (“GTX”) and retail (“OEC”) clients. GTX serves institutional clients that trade in the Forex market. In this case GCAP is just creating a platform/environment where institutions can trade positions amongst themselves without the use of GCAP’s market making services. GTX was established in 2010 and accounted for 10% of revenue in 2012. Through the acquisition of Open E Cry (“OEC”) late in the third quarter of 2012 the company has offered a commissioned-based platform for its retail customers to trade exchange-traded futures products. OEC accounted for 4% of revenues in 2012.
To summarize, GCAP generates revenues through:
- Retail trading-Individual investor through market making activities (forex products and precious metals via website Forex.com).
- Commission based institutional revenue (trading forex products)
- Commission based retail revenue (exchange traded futures products)
Challenges
Growth over the past several years has been flat or inconsistent. Certain market conditions have not been advantageous to GCAP’s operations since they are heavily tied to retail clients. (10k p. 41)
“During the past few years, there has been significant disruption and volatility in the global financial markets. Our revenue and operating results may vary significantly from period to period due primarily to movements and trends in the world’s currency markets and to fluctuations in trading levels. As a general rule, our businesses typically benefit from volatility in the markets that we serve, as periods of increased volatility often coincide with higher levels of trading by our clients and a higher volume of transactions. However, periods of extreme volatility may result in significant market dislocations that can also lead clients to reduce their trading activity. In addition, volatility that results in trading within a relatively narrow band of currency prices may lead to less profitable trading activity.”
Basically, the company’s reliance on the retail customer can reduce the consistency and visibility of its operating performance, since individual investor trading activity is more emotional and less business driven than that of its institutional clients. To be clear, the institutional investors’ trading activities will also be impacted by the same market conditions that affect the retail investor, but to a lesser degree. The retail investor can be “forced” out of the market quicker and take more time to resume aggressive trading activities.
Still, it is our belief that as long as the financial markets do not face a catastrophic period such as one brought on by the 2008 global recession retail trading volume should remain healthy. We also believe that the incentives for both the institutional and retail investor who trade in the futures and Forex markets will increase. For example, the spread of interest rates between U.S. and Europe will likely widen as investors speculate that actions taken by the Federal Reserve will lead to an increasing rate environment in the U.S., compared to a declining/stable rate environment in Europe where the outlook for growth is still uncertain. A wider interest rate differential and associated volatility will create more trading opportunities.
So Why Do We Currently Like The Stock?
Aside from the fact that GCAP pays a dividend yielding 3.6% at current prices and that it is aggressively buying back its stock…
- Approximately $9 million worth of stock repurchased from May 2011 through March 2013.
- Just increased authorized buyback program by $15 million.
…the company is seeking ways to improve its growth profile.
In a nutshell, while GCAP will never be able to eliminate “volatility risk”, the company is attempting to gain access to new sources of revenue that will diversify operations and lead to more consistent cash flows.
Management is seeking ways to add fresh sources of revenue and jumpstart growth by doing the following:
- Increasing revenues from the commission based business.
- Increasing overall customer accounts organically and through acquisitions.
- Putting greater emphasis on growing its institutional business.
- Gaining retail exposure into global markets where the company’s exposure has been limited.
- Increasing its product offerings.
Despite the challenges that market volatility can have on company operations, it is important to emphasize that the company has significantly grown its retail client base through market gyrations. GCAP’s retail customers, which include both Forex.com customers and OEC customers, open accounts with the company that are then tracked through a data point categorized as client assets.
GCAP Retail Client Assets (2012 10K pg.2)
| 2012 | 2011 | 2010 | 2009 | 2008 | 2007 | 2006 | |
| Assets in Millions USD | |||||||
| Client Assets | $446.3 | $310.4 | $256.7 | $199.8 | $124.0 | $108.9 | $75.6 |
Note: includes retail forex (trading) client assets and OEC (commission) client assets
Ultimately, a larger retail client base will lead to more cash flow whenever its clients decide to be more active in their trading activities. When looking at a company like GCAP it is more important to analyze cash flow potential rather than cash flow at a current point in time.
Acquisitions will play a big part in achieving company goals.
2012 initiatives to diversify operations: (10k p. 3)
“…
- The acquisition of Open E Cry, LLC, or OEC, an internet based futures business, from optionsXpress, a subsidiary of The Charles Schwab Corporation, which enables us to offer futures products and connections to dozens of exchanges around the world;
- The acquisition of all retail forex customer accounts held at the U.S. regulated subsidiary of Global Futures & Forex, Ltd., or GFT;
- The introduction of TRADE, a new retail platform featuring an expanded portfolio of forex and CFD products that includes innovative tools for market monitoring, technical trading and strategy building;
- The launch of the FOREX.com service in Canada; and
- The hiring of the 14 person execution desk from Peregrine Financial Group to bolster GTX’s specialty execution desk.
Founded in 1997, GFT offers forex, CFDs, spread betting, binaries, and FX options primarily through its proprietary, award-winning Dealbook® platform. GFT has built an extensive network of partners throughout the world that have accounted for over 75% of GFT’s retail trading volume in 2012. In addition, GFT’s growing Sales Trader business, which accounted for approximately 40% of GFT’s total trading volume in 2012, fits well with GCAP’s institutional execution desk, providing a substantial opportunity to expand the Company’s institutional business.
…”
We believe that the focus to grow the commission business (institutional and retail) is a key factor in reducing the overall risk profile of the company as well as in the expansion of valuation multiples. Not only does it introduce revenue that is stickier than its trading revenue, but it also reduces risk exposure to market-making as a percentage of total revenue. We already stated that the institutional commission revenue is more consistent than retail trading revenue. Additionally, management believes that commission based retail revenue will be less volatile than retail trading revenue. (Investors who trade exchange-traded futures exhibit more consistent activity than those who trade forex products).
Furthermore, commission-based revenue is a new source of revenue. The company expects commission-based revenue to comprise around 20% of total revenue in 2013, up from 14% in 2012 (10% institutional, 4% retail). The company’s goal is for commission-based revenue to comprise somewhere in the range of 40%-50% of its total revenue.
The following table shows that commission-based revenue can grow even when trading revenue does not.
GCAP Trading and Commission Revenue
| 2012 | 2011 | 2010 | 2009 | 2008 | 2007 | 2006 | |
| Revenue in Millions USD | |||||||
| Trading Revenue | $127.5 | $175.9 | $187.4 | $153.4 | $186.0 | $118.2 | $69.5 |
| Commission Revenue | $21.4 | $4.6 | n/a | n/a | n/a | n/a | n/a |
| Total Revenue | $151.4 | $181.5 | $189.1 | $153.3 | $188.1 | $119.3 | $70.4 |
Source: Various 10-K’s
Note: Total Revenue also accounts for other revenue not shown in chart.
FXCM Inc. (FXCM) is a direct competitor of GCAP that completed its IPO on December 3, 2010. Notice that FXCM is also increasing its emphasis on institutional revenue.
FXCM Retail and Institutional Trading Revenue
| 2012 | 2011 | 2010 | 2009 | 2008 | |
| Revenue in Millions USD | |||||
| Retail Trading Revenue | $339.7 | $363.8 | $318.5 | $291.7 | $281.4 |
| Institutional Trading Revenue | $62.0 | $28.9 | $27.8 | $21.1 | $18.4 |
| Total Trading Revenue | $401.7 | $392.7 | $346.3 | $312.8 | $299.8 |
Source: Various 10-K’s
Like GCAP, FXCM is employing an aggressive acquisition strategy.
Even though GCAP currently trades at a Price to TBV (Tangible Book Value) of 1.39 vs FXCM’s TBV1 of 2.02, on the surface it appears that it is not terribly undervalued when comparing its PE, Price to Sales, EV to Sales, and EV to EBITDA ratios to that of FXCM…
FXCM vs. GCAP P/E, EPS, Sales, EBITDA and Dividend Yield Comps5
| Trailing 12 month (TTM) P/E | P/E on 2013 Estimated EPS | P/E on 2014 Estimated
EPS |
Price to TTM Sales | EV to TTM Sales | EV to current EBITDA Run Rate2 | Dividend Yield | First QTR. 2013 EBITDA Margins | |
| FXCM | 22.52 | 16.7 | 13.0 | 1.22 | 1.023 | 2.03 | 1.7% | 33%4 |
| GCAP | 16.02 | 13.3 | 10.7 | 1.17 | 1.16 | 6.5 | 3.6% | 15% |
———-
Footnotes
1This includes non-controlling interest of Lucid, a company in which FXCM acquired a 50.1% stake in June of 2012. If we exclude Lucid from the calculation, price to TBV equates to 8.45 per share.
2Our non-GAAP calculation includes the adding back of amortization of intangible assets and stock compensation expense.
3FCXM EV multiple diverges from Yahoo data since we adjusted it to reflect minority interest.
4Excludes Lucid non-controlling interest.
5Data based on closing prices as of June 7, 2013
———-
…but we believe investors who arrive at this conclusion need to consider recent developments that will soon render GCAP’s current valuation multiples to be stale.
The Arbitrage Opportunity
The biggest development that has not been fully reflected in shares of GCAP is the anticipated close of the “Transformative” acquisition of Global Futures & Forex, LTD (GFT), announced on April 25, 2013, that will significantly increase its institutional and global customer footprint. GCAP expects the transaction to close by the third quarter of 2013.
- The transaction is expected to be accretive in the first full quarter after closing.
- First year operating synergies are estimated at $35-$45 million.
- The combined company will have pro forma client assets of approximately $650 million.
- 2013 revenue run-rate of $329 million, based on first quarter 2013 revenues of $49.8 million and $32.5 million for GCAP and GFT, respectively.
- 2013 pro forma EBITDA run-rate of $77 million, based on first quarter 2013 EBITDA of $7.5 million and $1.8 million for GCAP and GFT, respectively, and assuming the mid-point of first year operating synergies achieved.
- GFT’s extensive network of partners will extend GAIN’s global reach to new client bases.
- GFT’s diverse product offering creates an opportunity to cross-sell with GAIN’s existing clients
Founded in 1997, GFT offers forex, CFDs, spread betting, binaries, and FX options primarily through its proprietary, award-winning Dealbook® platform. GFT has built an extensive network of partners throughout the world that have accounted for over 75% of GFT’s retail trading volume in 2012. In addition, GFT’s growing Sales Trader business, which accounted for approximately 40% of GFT’s total trading volume in 2012, fits well with GCAP’s institutional execution desk, providing a substantial opportunity to expand the Company’s institutional business.
Since the acquisition is slated to close by the third quarter of 2013, some investors will prefer to wait on the sidelines for the “official” closing of the GFT transaction. In the meantime, opportune investors who buy shares now can capture a dividend yield of 3.6% as they wait for events to unfold and as the stock gradually approaches a valuation that assumes the GFT deal closes.
Valuation:
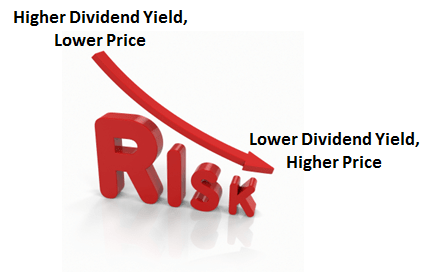
It is common knowledge that a reduction in a company’s risk profile should lead to an expansion in its valuation multiples. Generally speaking, a portion of a stock’s dividend yield incorporates a risk premium assumption. The higher the risk, the higher the yield investors will require. Conversely, as the perception of the investment becomes less risky, the dividend yield should decline.
The price of a stock has an inverse relationship with changes in dividend yields.
 The GFT acquisition will bring GCAP revenues and EBITDA much closer to FXCM’s 2013 estimated revenues ($491 million) and EBITDA ($206 million). Furthermore, we believe that GCAP’s strategic objectives will make shares more attractive to a wider investor base. When one considers that GCAP will be a more substantial company in terms of size/product offerings with a better risk profile one can begin to believe that GCAP’s dividend yield of 3.6% could approach that of FXCM’s yield of 1.7%, translating into an eventual price target of $12.50. This may seem expensive using current analyst EPS estimates…
- P/E of 30.5 on 2013 EPS estimates of $0.41
- P/E of 24.5 of 2014 EPS estimates of $0.51
… but will likely prove to be on the mark once estimates are updated for the GFT acquisition, when GCAP approximates that operating synergies alone will lead to around $40 million in savings. Furthermore, EBTDA margins are expected to expand 53% to 23%. Also, keep in mind that GCAP’s 2013 EBITDA guidance only assumes the midpoint of cost synergies that will result from the acquisition of GFT. Therefore, we believe upside surprises to guidance and valuations targets exist.
Until more data is disclosed regarding the financials of the GCAP/GFT combined entity, forward looking P/E and EV calculations will be a bit imprecise. But for now, we can look at 2013 Price to Sales comparisons.
Trailing revenues:
- FXCM trailing twelve month revenues of $437.6
- GCAP trailing twelve month revenues of $167.3 million
GCAP’s Price to Sales ratio is currently 1.17, compared to 1.22 for FXCM. With the company’s anticipated post acquisition revenue run-rate of $329 million and additional 4.9 million shares of GCAP common stock to be issued to consummate the deal yields a price target of around $9.40. Applying FXCM’s price to sales multiple would equate to a price target of around $10
Competition Respects GCAP
It is always encouraging when a competitor of a company that we are considering a long position in takes action that can validate our bullish thesis.
On April 9, 2013 GCAP announced that it received a proposal from FXCM to acquire the company for 0.3996 shares of FXCM Class A common stock for each share of GCAP common stock. The transaction would have valued GCAP at around $5.35. FXCM later withdrew its proposal upon the GFT acquisition announcement. Regardless, it was pretty obvious that GCAP did not plan to accept the FXCM offer and rejected the offer. Management immediately adopted a shareholders rights plan:
“The rights plan is designed to reduce the likelihood that a potential acquirer would gain control of the Company by open market accumulation or other tactics without paying an appropriate premium for all of the company’s shares.”
“The stockholder rights plan allows the Board to fully consider and evaluate an unsolicited proposal and provides an appropriate opportunity to consider alternatives to maximize stockholder value.”
Shares of GCAP were trading at around $4.40 prior to the FXCM offer and eventually reached a 52 week high of $5.99 on April 25, 2013 when it announced news of its potentially transformative acquisition. However, shares eventually retreated to around $4.50 by May 2, 2013, as traders who bought the stock on the heels of the FXCM short-lived acquisition proposal exited the stock. Here is a note that we sent to GeoInvesting premium members:
“Gain Capital Holdings (NYSE:GCAP) ($4.75) shares have been weak despite recent positive news regarding a potentially accretive acquisition on 4/25/2013. We believe shares have fallen due to possibility that some investors who bought the stock unloaded positions when the offer of $5.40 was taken off the table. The fundamentals of the company look very compelling. The recent acquisition would double the size of a company that already seems undervalued. We are coding GCAP as a GeoBargain on the radar at $4.75. We will continue to perform more due diligence in this name.”
Shares of GCAP have regained most of the aforementioned decline; a scenario we believe will continue to occur as investors and analysts up their revenue and EPS estimates once the GFT acquisition closes.
2013 Off To A Good Start
Investors should also note that GCAP is experiencing growth aside from the new level that the GFT acquisition will take the company to and that analyst had already expected 2013 and 2014 earnings to grow nicely.
| 2012 | 2013 | 2014 | |
| Adjusted EPS1 | $0.23 | $0.41E (78% growth) | $0.51E (24% growth) |
1Our non-GAAP calculation includes the adding back of amortization of intangible assets and stock compensation expense.
2013 First Quarter Press Release Comments:
“I am pleased to report strong results for the first quarter, with a 50% increase in net revenue and EBITDA rising to $7.5 million from $1.3 million, as all of our core business areas posted significant growth amid improved market conditions,” said Glenn Stevens, CEO of GAIN Capital. “At the same time, we accelerated the diversification of our net revenue, with commission-based businesses representing 22% of net revenue in the first quarter, compared with 11% in the first quarter of 2012.”
“We also reported positive trends in key operating metrics, with client assets rising 40% to a record $456.9 million and funded accounts growing 36% to 100,020, thanks to a mix of acquisitions and organic growth. This was accomplished while managing costs in order to achieve significant operating leverage.”
“Our positive momentum continued in April, which saw retail and institutional volumes increase 26% and 103% on a year-over-year basis, while futures DARTs rose 10% from March 2013. With superior product offerings in our retail, institutional and futures businesses, GAIN has been able to capitalize on improved market conditions across its expanding global operations,” Mr. Stevens said.
Monthly Metrics Report for April 2013:
“We are pleased to report that our positive momentum continued in April, with sequential and year-on-year volume growth across all our business lines, as improving market conditions helped boost client engagement,” said Glenn Stevens, CEO of GAIN Capital. “In April, our retail client assets reached a record of $466.4 million and our institutional business continued to attract new customers and grow liquidity. These factors, combined with our pending acquisition of GFT, which is on track to close in the third quarter, put us in a strong position to capitalize on more favorable market conditions.”
Conclusion:
Investors who want to value GCAP post-acquisition on Earnings per Share and Enterprise Value metrics will have to wait until the company discloses more details on the financials of GFT, but by then it may be too late. We prefer to look at GCAP in the context of its entire business plan and how the GFT deal will take the company on a new level. Investors who take calculated risks before all the cards are on the table are those that earn “Alpha” in an increasingly efficient market.
Risks
- Miscalculation of the risk of un-hedged positions.
- Client inability to honor margin calls.
- The retail investors get spooked out of the market.
- Acquisition integration risk.
Disclosure: Long GCAP
Company Contact Information:
Website: http://www.gaincapital.com/
Investor Relations: Hugh Collins/Lynn Morgen 1-212-750-5800
Disclaimer:
You agree that you shall not republish or redistribute in any medium any information on the GeoInvesting website without our express written authorization. You acknowledge that GeoInvesting is not registered as an exchange, broker-dealer or investment advisor under any federal or state securities laws, and that GeoInvesting has not provided you with any individualized investment advice or information. Nothing in the website should be construed to be an offer or sale of any security. You should consult your financial advisor before making any investment decision or engaging in any securities transaction as investing in any securities mentioned in the website may or may not be suitable to you or for your particular circumstances. GeoInvesting, its affiliates, and the third party information providers providing content to the website may hold short positions, long positions or options in securities mentioned in the website and related documents and otherwise may effect purchase or sale transactions in such securities.
GeoInvesting, its affiliates, and the information providers make no warranties, express or implied, as to the accuracy, adequacy or completeness of any of the information contained in the website. All such materials are provided to you on an ‘as is’ basis, without any warranties as to merchantability or fitness neither for a particular purpose or use nor with respect to the results which may be obtained from the use of such materials. GeoInvesting, its affiliates, and the information providers shall have no responsibility or liability for any errors or omissions nor shall they be liable for any damages, whether direct or indirect, special or consequential even if they have been advised of the possibility of such damages. In no event shall the liability of GeoInvesting, any of its affiliates, or the information providers pursuant to any cause of action, whether in contract, tort, or otherwise exceed the fee paid by you for access to such materials in the month in which such cause of action is alleged to have arisen. Furthermore, GeoInvesting shall have no responsibility or liability for delays or failures due to circumstances beyond its control